Setting custom timestamps for prometheus metrics
TLDR #
To associate a custom timestamp with a Prometheus metric:
- Write a custom collector - you can’t use the built-in
Gaugeclass in the Python client. - Write a custom exporter. This is a web server that exposes the timestamped metrics in the
*.promfile such that Prometheus can scrape them. The built-in textfile collector does not support timestamped metrics. - Update your Prometheus config scrape targets with the address of the new exporter.
- Update your Prometheus config to set
out_of_order_time_window.
Contents
- TLDR
- Background
- Custom collectors
- Custom exporters
- Updating Prometheus config scrape targets
- Updating Prometheus config:
out_of_order_time_window - Conclusion
Background #
By default, the timestamp associated with a Prometheus metric is the timestamp at which the metric was scraped by Prometheus. But sometimes, one wants to associate a custom timestamp with a data point. Prometheus is very opinionated and does not make this easy, but it is possible.
My use case for setting custom timestamps was monitoring local air quality. The New York City government has an API where the city’s air quality is reported. While the API is “realtime”, in practice the data is 2 - 4 hours delayed. The data returned from the API is formatted as <timestamp>,<air_quality>:
2024-07-07T10:00:00,5.59
2024-07-07T11:00:00,6.35
2024-07-07T12:00:00,6.75
2024-07-07T13:00:00,6.59
I want Prometheus to associate the timestamp of the air quality reading with the data point rather than the timestamp at which the metric was scraped by Prometheus, which may be 2 - 4 hours later.
Custom collectors #
I’ll be working with Prometheus’s Python client in these examples. I was using a gauge to record the air quality data. Unfortunately, the gauge’s set method exposes no parameter to use a custom timestamp. I discovered on github that we can accomplish our goal with a custom collector. The add_metric method exposes timestamp as an optional parameter. The timestamp should be a unix epoch timestamp in milliseconds.
import prometheus_client
from prometheus_client.core import GaugeMetricFamily

class CustomTimestampedGaugeCollector(prometheus_client.registry.Collector):

    def collect(self):
        value, timestamp = get_data()
        gauge_with_custom_timestamp = GaugeMetricFamily(
            'my_metric_name', 'my_metric_description.'
        )
        gauge_with_custom_timestamp.add_metric([], value, timestamp)
        yield gauge_with_custom_timestamp
For reference, here’s my air quality monitoring code before I started associating timestamps with the data. I was using the gauge’s set method and unable to pass a custom timestamp. This code would write a .prom file that looked like:
# HELP city_pm25 Concentration of PM 2.5 in local city. Units: μg/m^3.
# TYPE city_pm25 gauge
city_pm25 6.51
And here’s my code after I started associating timestamps with the data via a custom collector. This code writes a .prom file that looks like:
# HELP city_pm25 Concentration of PM 2.5 in local city. Units: μg/m^3.
# TYPE city_pm25 gauge
city_pm25 6.51 1720375200000
Custom exporters #
Problem solved, right? Wrong. I had been using the node_exporter’s textfile collector to export my data. But the textfile collector does not support custom timestamps:
Note: Timestamps are not supported.
You’ll see something like this in logs if you try to use the textfile collector with a *.prom file that has timestamps:
NODE_EXPORTER[669]: ts=2024-07-06T11:16:03.618Z caller=textfile.go:227 level=error collector=textfile msg="failed to collect textfile data" file=city_data.prom err="textfile \"/tmp/city_data.prom\" contains unsupported client-side timestamps, skipping entire file"
Here’s the node_exporter code that explicitly disallows timestamps.
I discovered on the Prometheus mailing list that a custom exporter can solve the problem. It’s easy enough to write an exporter - the basic idea is that we need to expose the timestamped metrics in the *.prom file via a web server such that Prometheus can scrape them. I wrote a custom exporter in Python, using Python’s built in HTTP server. Here’s the code - it exposes the metrics at http://<hostname>:9101/metrics.
The bulk of the work happens in the do_GET method. Here’s a simplified version of the code:
def do_GET(self):
    content = ''
    prom_dir = '/prom_dir'

    # read all *.prom files in the directory and concatenate their contents
    for file in os.listdir(prom_dir):
        if file.endswith(".prom"):
            path = os.path.join(prom_dir, file)
            content += open(path, 'r').read()

    # serve the data that was read.
    self.send_response(200)
    self.send_header("Content-Type", "text/plain; charset=utf-8")
    self.end_headers()
    self.wfile.write(bytes(content, 'utf-8'))
Updating Prometheus config scrape targets #
After creating the custom exporter and exposing the timestamped metrics on port 9101, we need to update the scrape targets in Prometheus config with the address of the new exporter. Here’s what my config looked like.
Updating Prometheus config: out_of_order_time_window #
Problem solved, right? Wrong again. Checking your Prometheus logs, you may see errors like this:
PROMETHEUS[1733468]: ts=2024-07-06T13:12:40.583Z caller=scrape.go:1729 level=warn component="scrape manager" scrape_pool=node target=http://study:9101/metrics msg="Error on ingesting samples that are too old or are too far into the future" num_dropped=1
I believe if the timestamped metrics you are attempting to ingest have timestamps that are older than approximately 1 hour, you may encounter this error. Prometheus has an experimental feature that solves this problem: out_of_order_time_window. See also this blog post announcing the feature. Since the air quality data I need to ingest is at most 2 - 4 hours delayed, it would be sufficient to use a value of anything greater than 4h. I decided to use a value of 1d just to be conservative. Here’s what my config looked like.
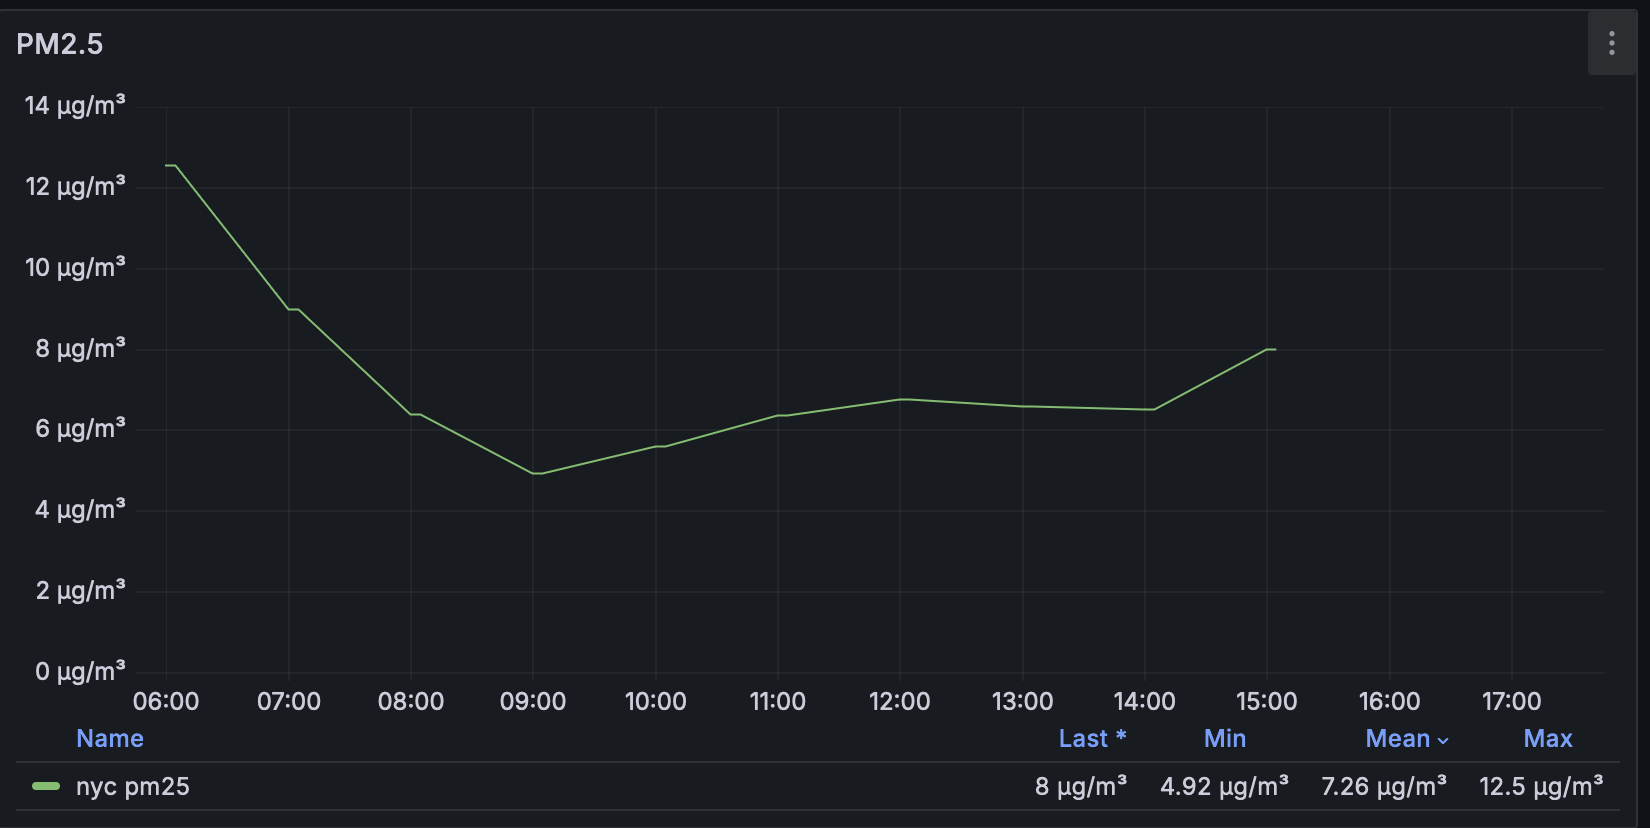
I can now see the NYC air quality data in grafana:
Conclusion #
This was a lot harder than I anticipated. We can’t use the out-of-the-box features to accomplish our goal - we instead had to write a lot of custom code. Prometheus is quite opinionated, and the maintainers seem to think that there are few valid use cases for setting custom timestamps on metrics.