Debugging Our New Linux Kernel
Read on to learn how we used network packet captures and BPF to debug web server performance, ultimately uncovering a Linux kernel performance issue. This investigation was a collaboration between myself and my colleagues.
See the discussion of this post on Hacker News.
Contents
- Background
- What are listen overflows?
- What’s causing listen overflows?
- Why were web requests served slowly in the first few minutes after new hosts were pooled?
- What’s causing elevated system CPU?
- The fix
- Followup questions
Background #
We’ve been upgrading the operating system from CentOS to Ubuntu on hosts across our fleet. Our CentOS hosts run an outdated Linux kernel version (3.10), whereas our Ubuntu hosts run a more modern kernel version (6.8). In August 2024, we began rolling out the Ubuntu upgrade across our Apache web servers. When we migrated larger portions of our fleet to Ubuntu, we began seeing elevated listen overflow errors. This elevated error rate prompted us to roll back the Ubuntu upgrade while we debugged:
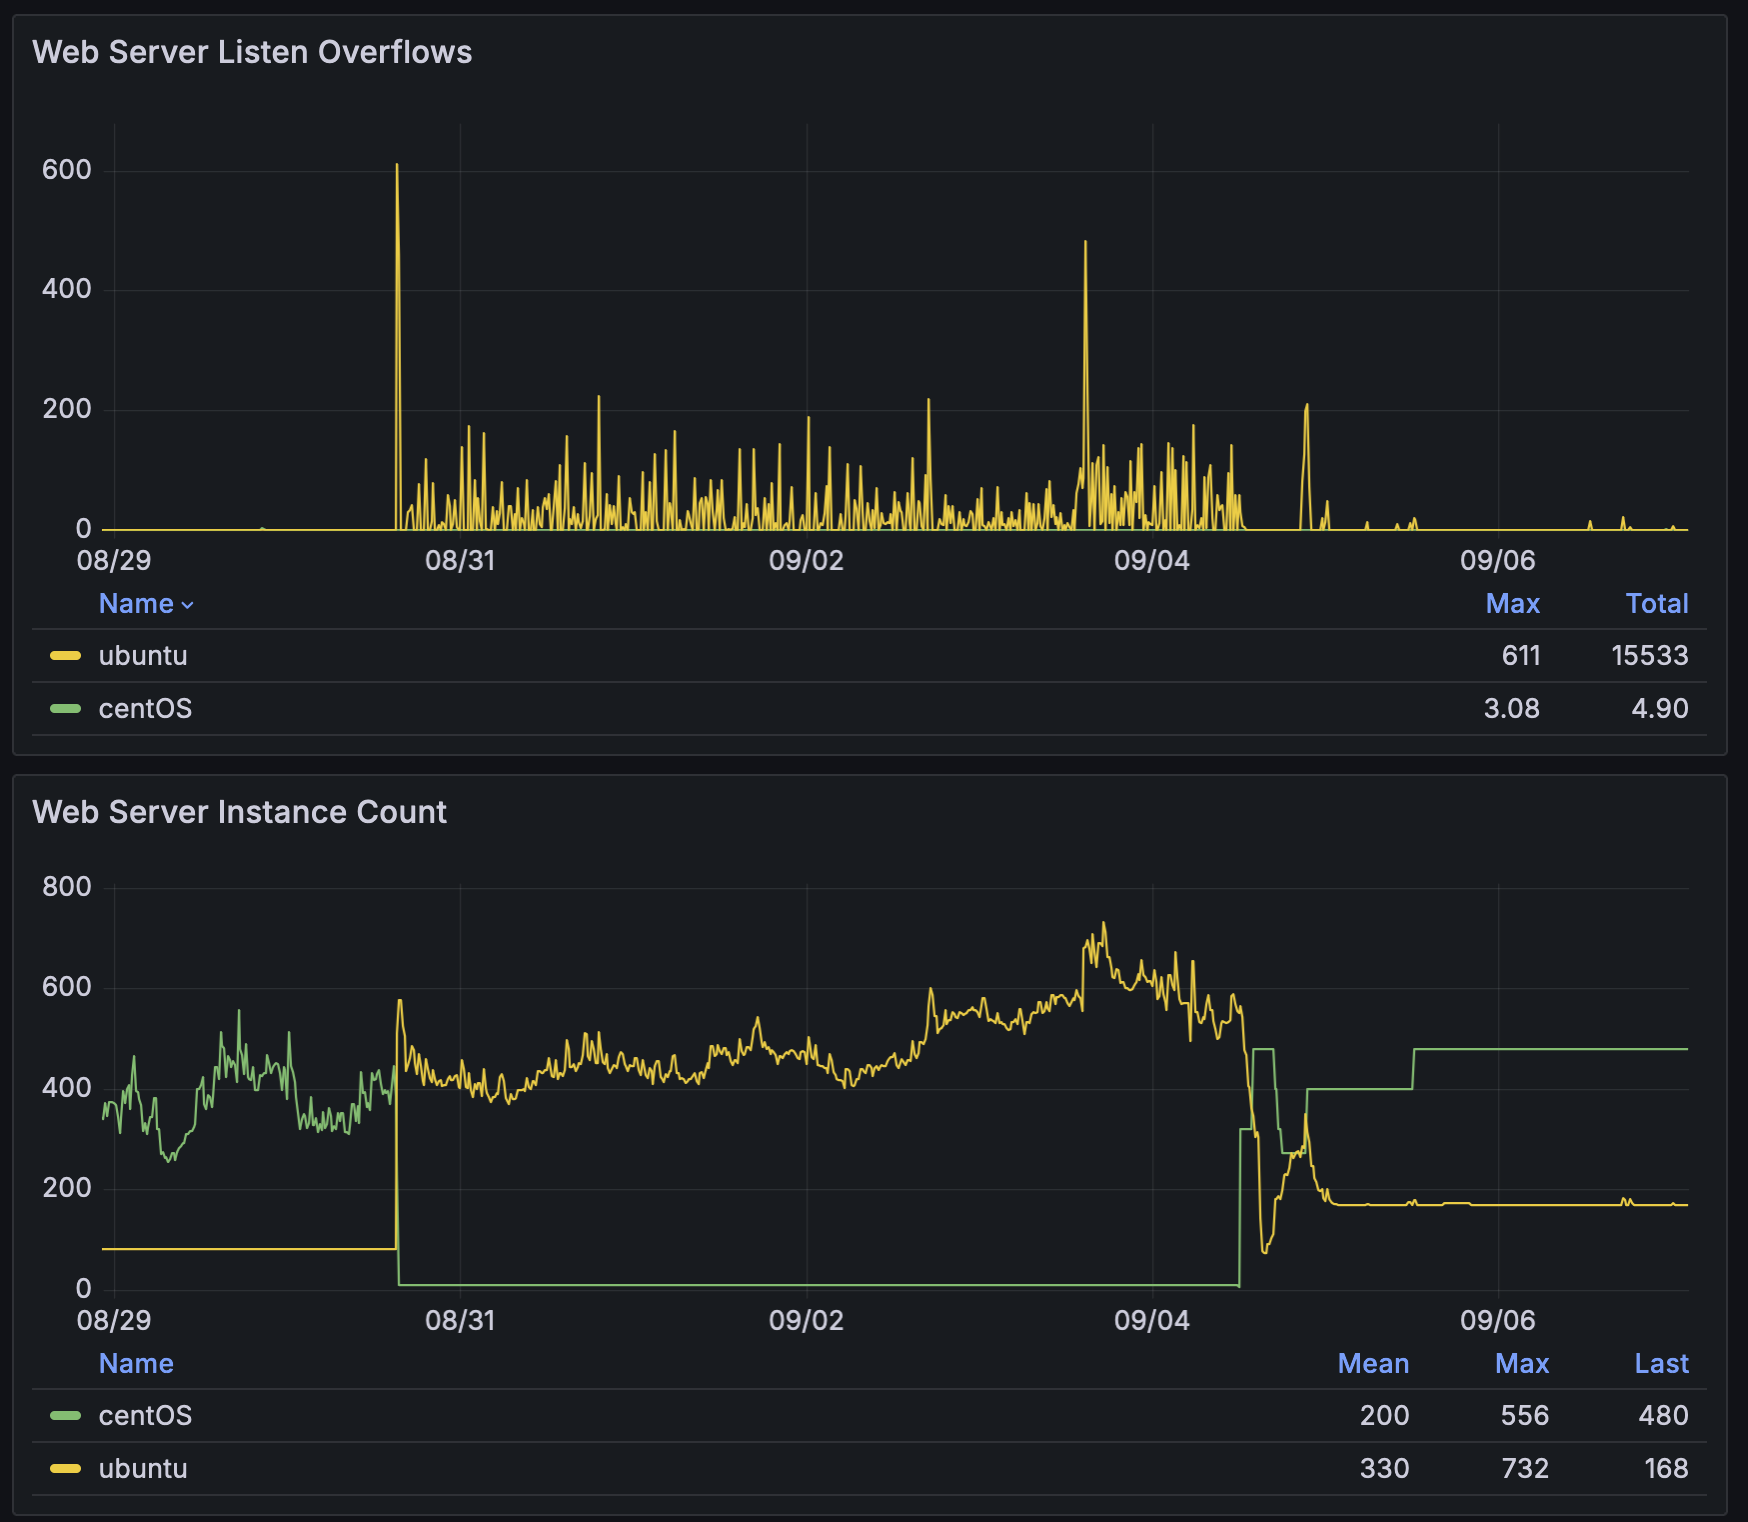
What are listen overflows? #
Apache listens on a socket for incoming web requests. When incoming requests arrive more quickly than Apache can serve them, the queue of requests waiting to be served grows longer. This queue is capped to a configurable size. When the queue overflows its maximum size, we have a listen overflow.
Listen overflows are a symptom of either of two things: the rate of incoming web requests is too high, and / or Apache is serving web requests too slowly.
Each listen overflow that occurs means we failed to serve a web request. This can result in user-facing errors. Furthermore, if the listen overflows are a symptom of web requests being served slowly, it means users may be experiencing slow page loads.
What’s causing listen overflows? #
Listen overflows occurred a few minutes after a newly autoscaled web server was pooled. They did not tend to recur subsequently. Furthermore, web requests had elevated latency during this same time period:
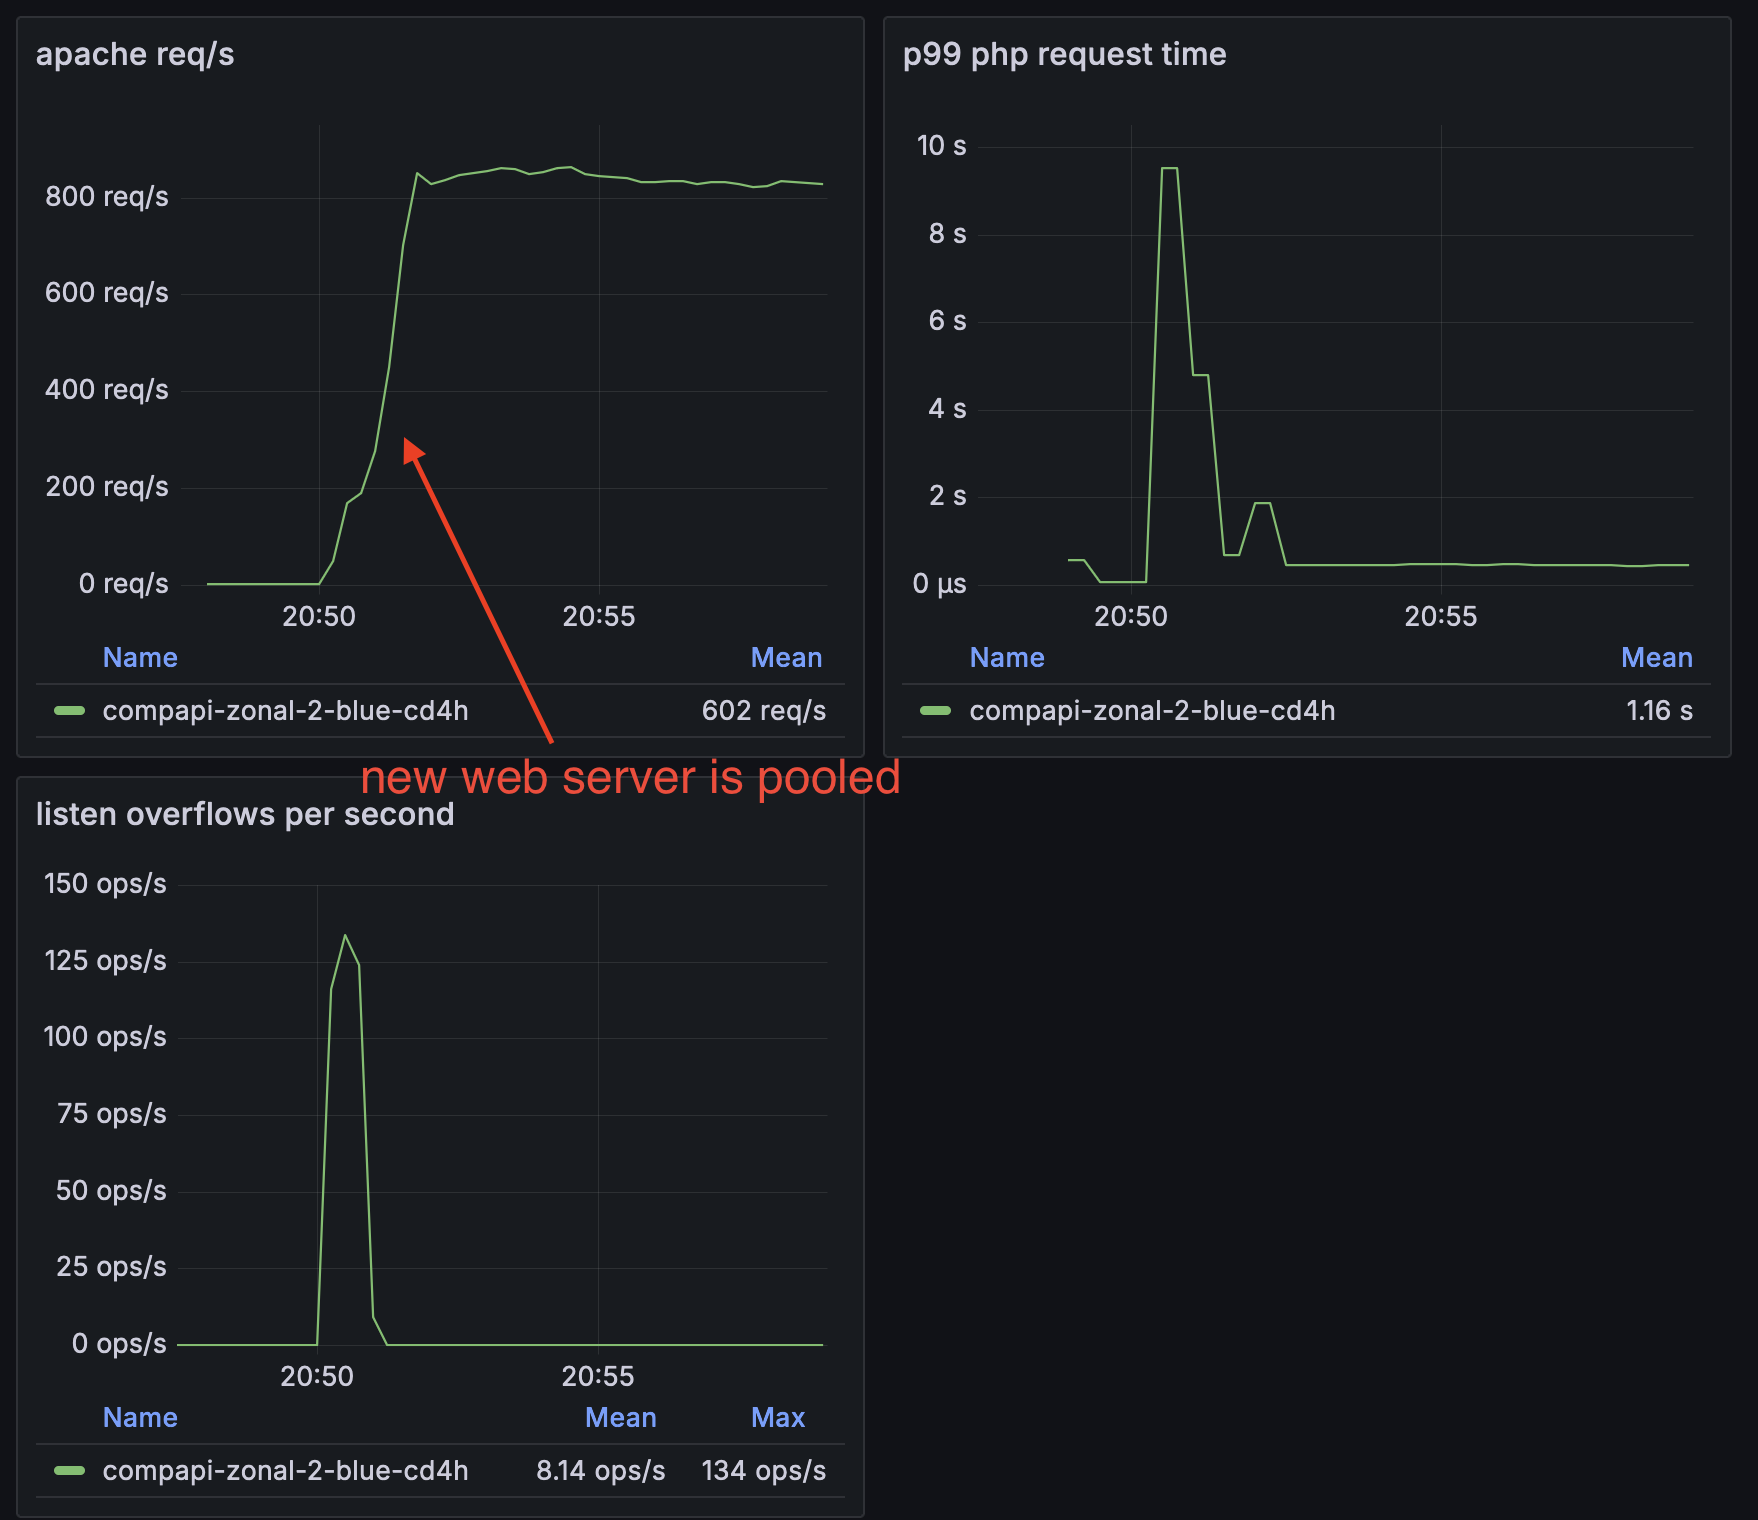
We believed listen overflows were occurring because web requests served in the first few minutes after the host was pooled were being served unusually slowly.
Why were web requests served slowly in the first few minutes after new hosts were pooled? #
Is it the network? (no) #
Log lines, strace timing information, and phpspy flame graphs showed that network operations were executing particularly slowly. But investigating further, we found evidence that the network was performing normally. Instead, PHP had seemingly stalled for over a second. The below log line indicates that a memcached SET command was slow, but network packet captures on both the client and the server that we analyzed in Wireshark indicate that the SET command experienced normal network latency. The client waited over 1 second before sending the subsequent GET command, as if our PHP script stalled after the packet was received but before we recorded the elapsed time.
[Tue Sep 24 21:20:54 2024] [info] Memcached operation exceeded 20ms :operation="set" latency="1354.68292236" key="warmup_key_7746_2"
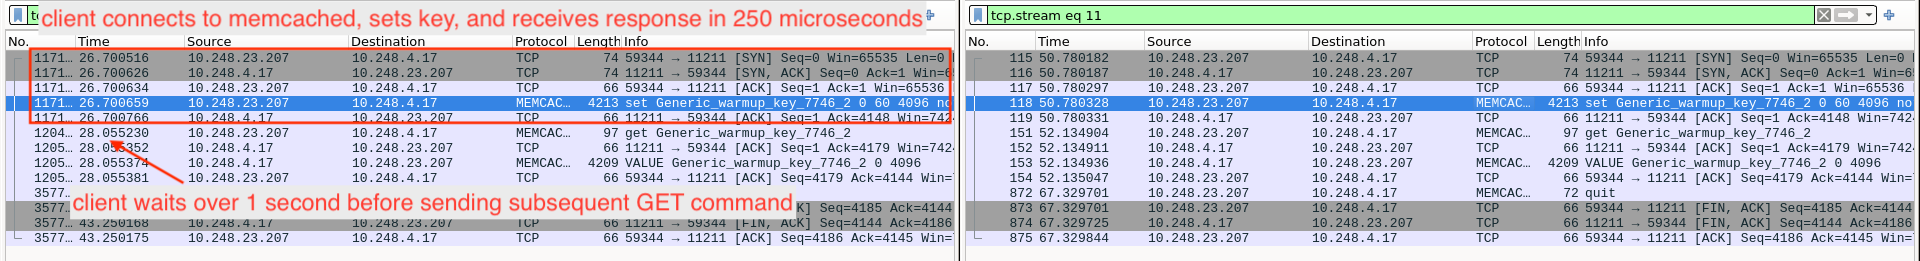 Left: client side (web server) packet capture. Right: server side (memcached) packet capture
See a bigger version of this image
Is it due to elevated system CPU? (yes) #
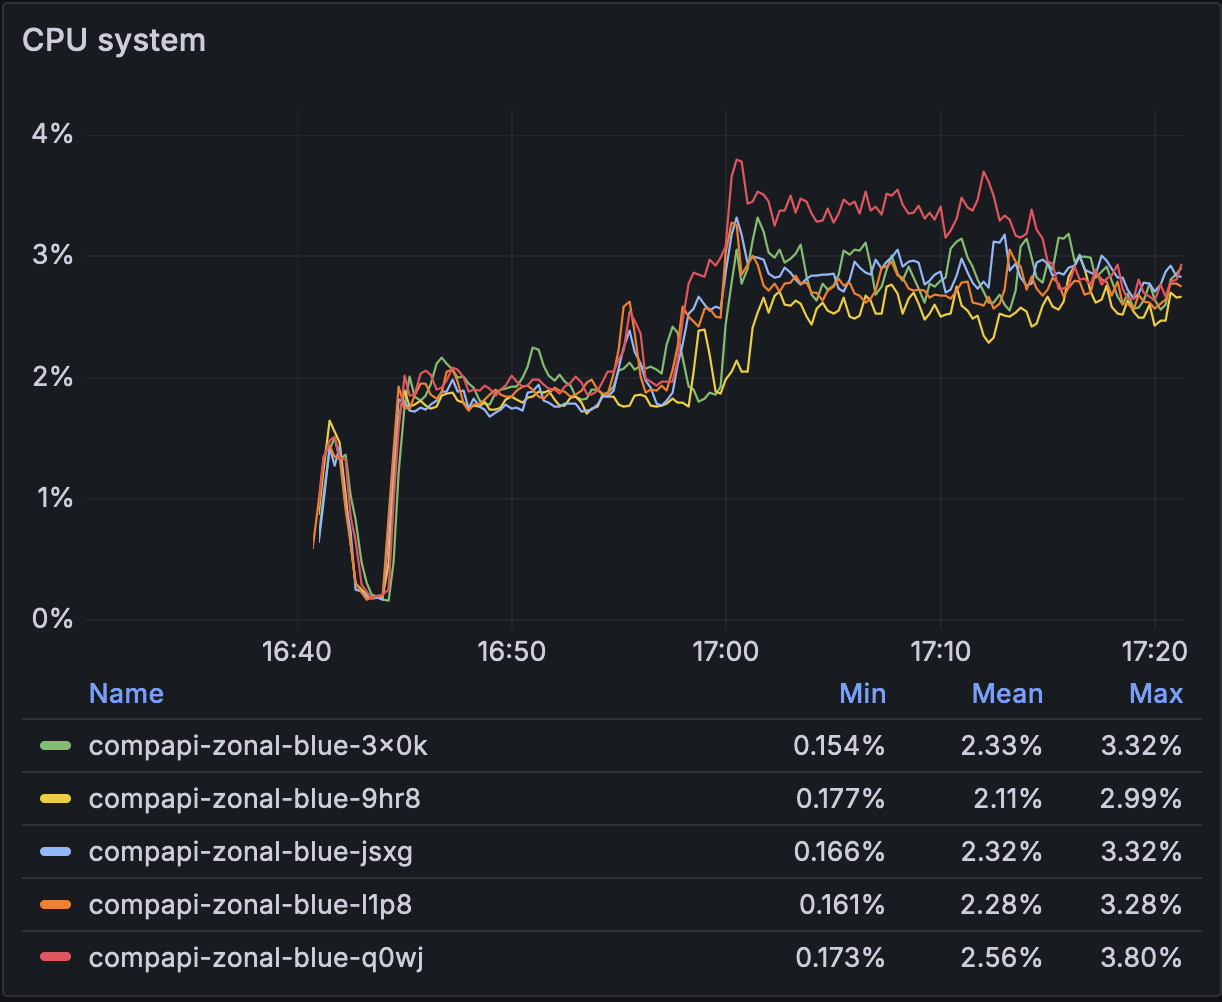
Adding on to the evidence pointing away from network problems, we saw a large spike in system CPU usage about four minutes after newly autoscaled hosts were booted. If we waited until after this spike in system CPU to pool the hosts, we experienced no listen overflows. This spike in system CPU only occurred on Ubuntu hosts – CentOS did not have this problem:
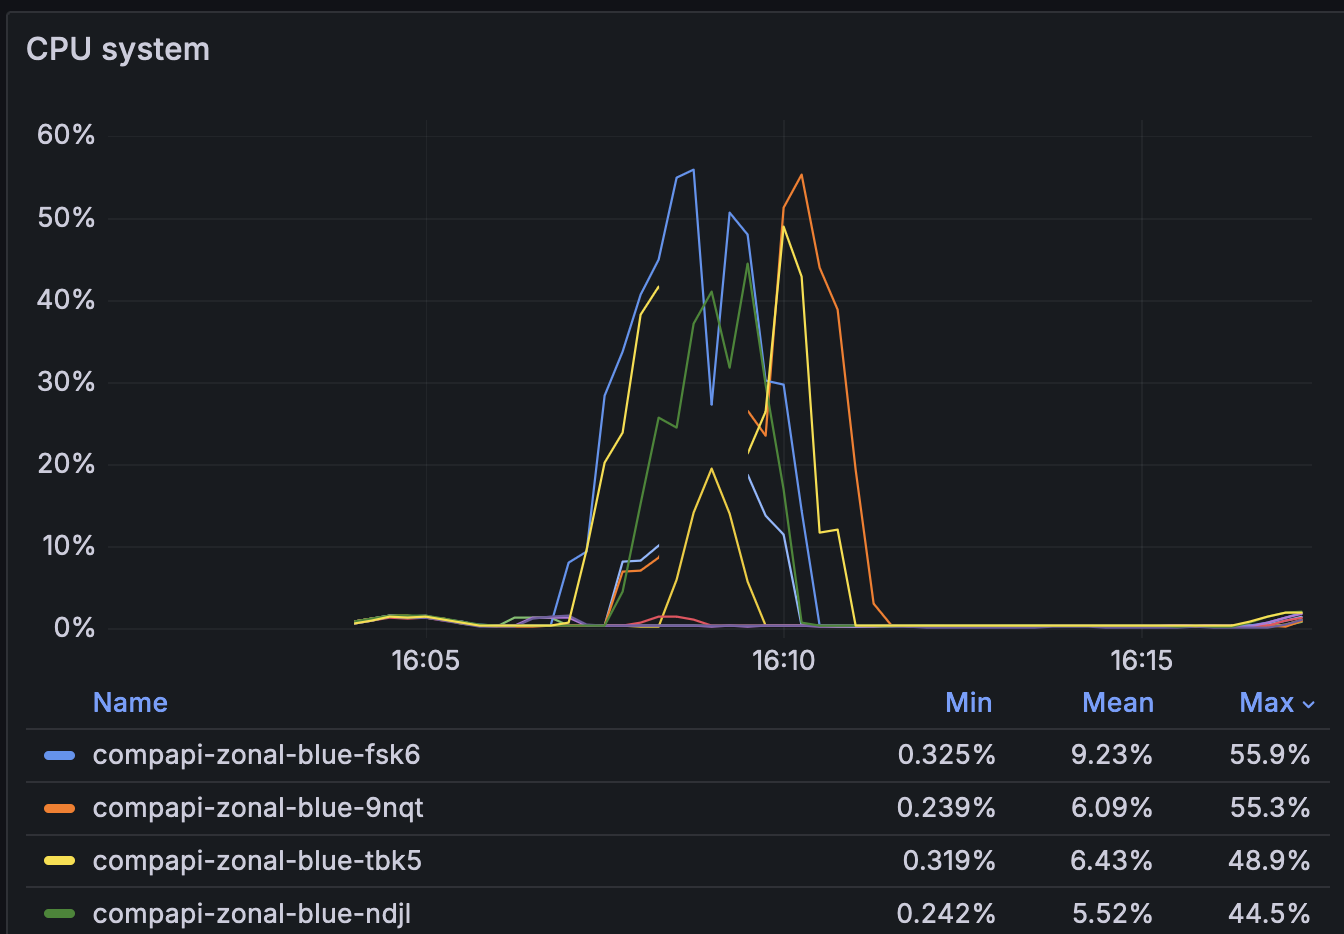
This made us realize that the problems we were seeing were unrelated to pooling the hosts – the spike in system CPU occurred regardless of whether the hosts were pooled. During the spike in system CPU, we saw logs in dmesg:
workqueue: inode_switch_wbs_work_fn hogged CPU for >10000us 4 times, consider switching to WQ_UNBOUND
And htop showed kernel workers were using lots of CPU in a function inode_switch_wbs:
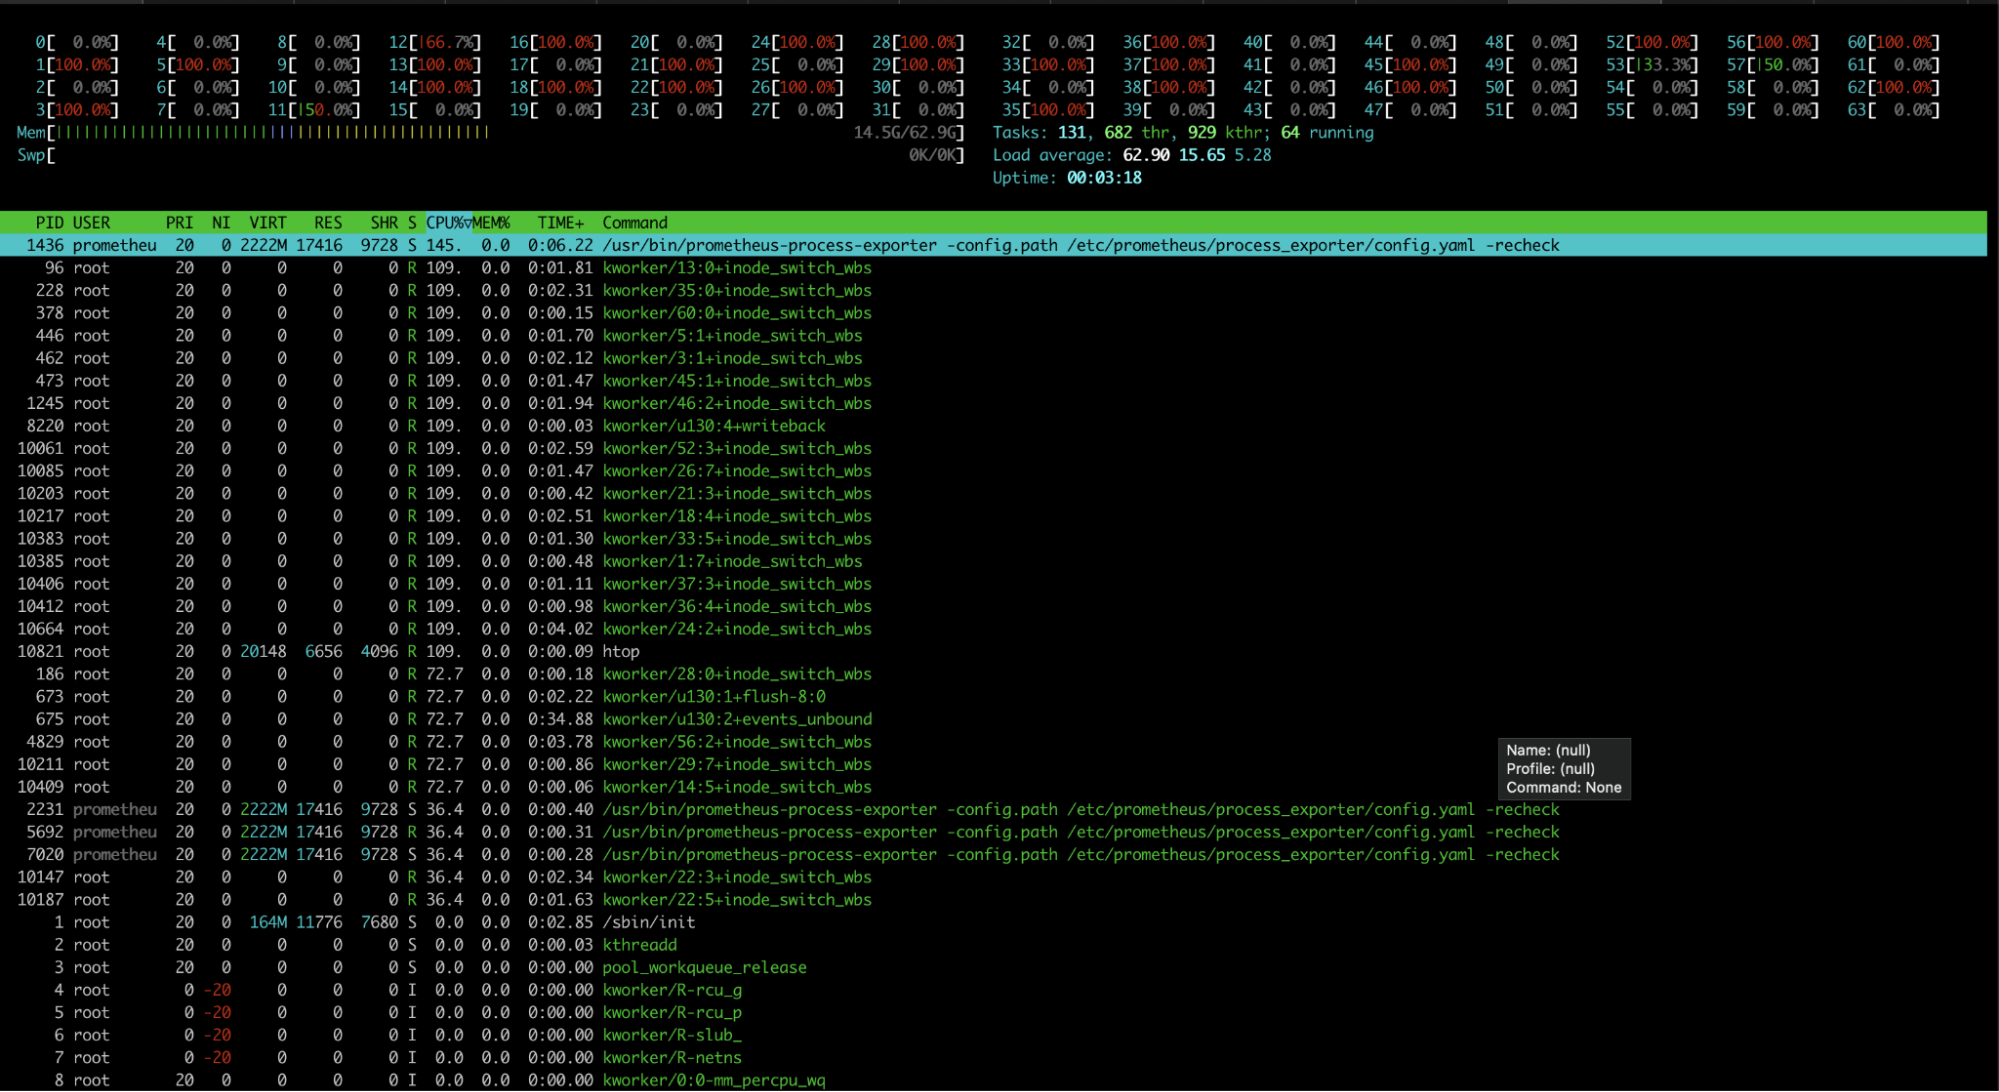
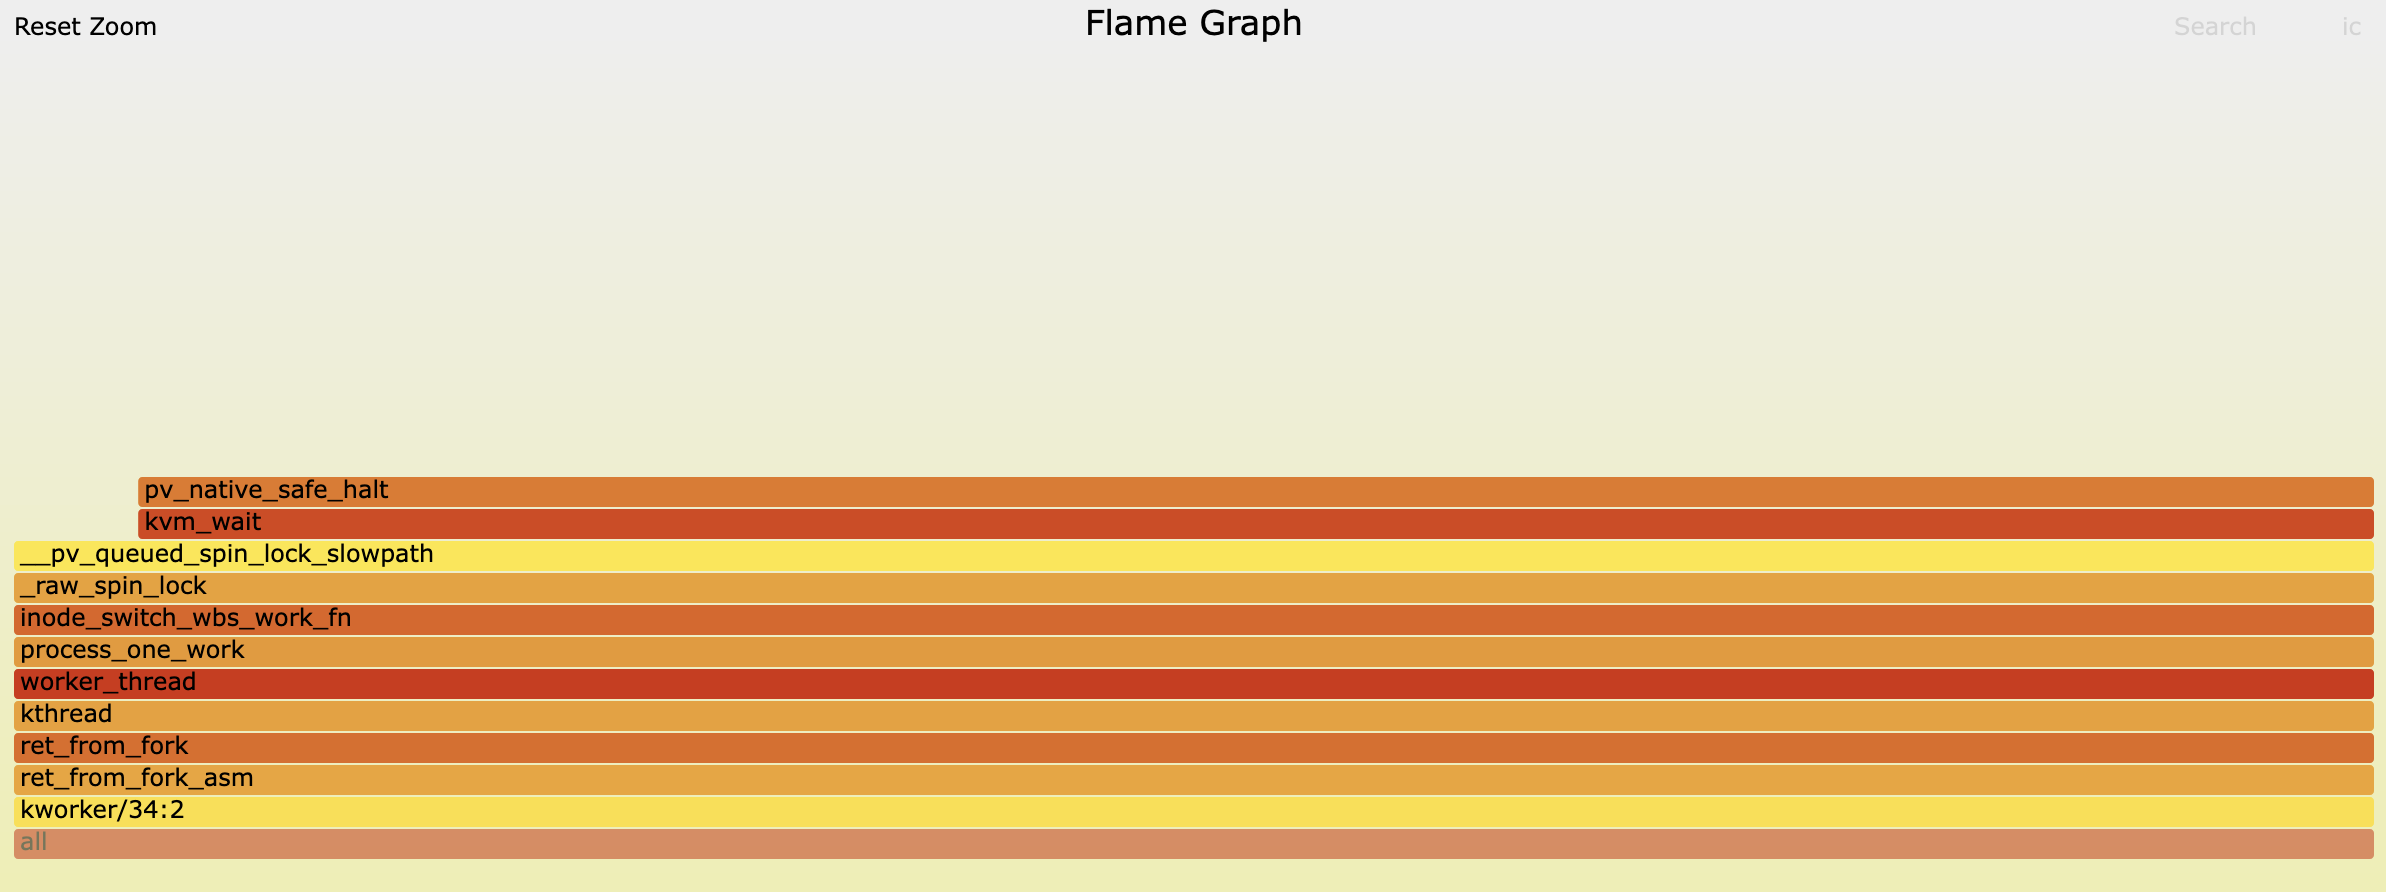
We made a perf recording demonstrating that when system CPU spikes, the kernel is busy inside inode_switch_wbs_work_fn:
Why did we initially suspect the network? #
Our logs and profiling tools showed that network operations were executing particularly slowly. However, when CPU is busy, network operations may appear to slow down disproportionately. Network calls require CPU context switches (I think?). After a process blocked on network receives a response, the process may spend a long time waiting in the CPU run queue before it gets scheduled again when the CPU is busy. Network operations that appear slow at the user space level may be a symptom of CPU busyness.
Although there can be cases where this is not true, it has been my experience that when the network is the cause of slowness, CPU usage on client hosts is often lower than normal. When the client is blocked waiting for the network, it is often more idle. In retrospect, perhaps the fact that elevated CPU was one of the symptoms we were seeing should have pointed us away from network issues.
What’s causing elevated system CPU? #
Is it writeback? (no) #
We believed something in the kernel function inode_switch_wbs_work_fn was causing elevated system CPU. This function is in a file fs-writeback.c, which contains functions related to the writeback functionality of the Linux page cache. We knew that system CPU was elevated about four minutes after new hosts were booted. One of the first things a new host does is download the latest code – this is part of our host bootstrapping process and involves writing thousands of files to disk. We wondered if the process of flushing the dirty pages to disk was causing the elevated system CPU. While we did not see elevated disk write metrics during the system CPU spike, we decided to test this theory. We added a sync call after the rsync command that downloads the code on new hosts. In theory, that should synchronously write the dirty pages in the page cache to disk. Perhaps by controlling when the page cache was flushed to disk, we could control when the spike in system CPU occurred and ensure that it occurred before we pooled the host. This attempt, however, was unsuccessful. We saw no spike in system CPU when calling sync. Furthermore, we still saw the spike in system CPU a minute or two later.
We were back to the drawing board. As we mentioned above, one of the first things a new host does is download the latest code. This process is called setupwebroot, and it runs as a systemd oneshot service. We found something perplexing: if we prevented the setupwebroot service from running, we never saw the spike in system CPU. And if we subsequently ran the setupwebroot service manually, we would see the spike in system CPU a couple minutes later. This implies that something in setupwebroot was the cause of the issues. However, if we ran the rsync command in setupwebroot manually in our interactive shell, we saw no spikes in system CPU. This apparent contradiction led us on a wild goose chase of trying to determine if some systemd service that was dependent on setupwebroot was the cause of the elevated system CPU, or if there was some subtle difference in the way we were running the commands in our shell versus how systemd was running the commands.
Is it inode cgroup switching? (yes) #
Each of the thousands of files that is written by the setupwebroot service has a corresponding index node, also known as an inode, that the kernel uses to store file metadata. Control groups, also known as cgroups, are a feature of Linux which allows for setting per process limits on system resources. For example, cgroups allow us to limit a given process from consuming too much memory, disk I/O, network bandwidth, etc. Every process belongs to a cgroup. Cgroups form a tree-like hierarchical structure. Processes in a given cgroup are given limits both by the cgroup to which they belong and that cgroup’s parents.
In the context of cgroups, page cache writeback is tracked at the inode level. A given inode is assigned to whichever cgroup contains the process that is responsible for the majority of writes to the inode’s file. If a new process starts writing a lot to a file, the file’s inode may switch to the new process’s cgroup. Likewise, if a process managed by systemd is terminated, systemd will remove the process’s cgroup, at which point any inodes assigned to the process’s cgroup will be moved to the parent cgroup.
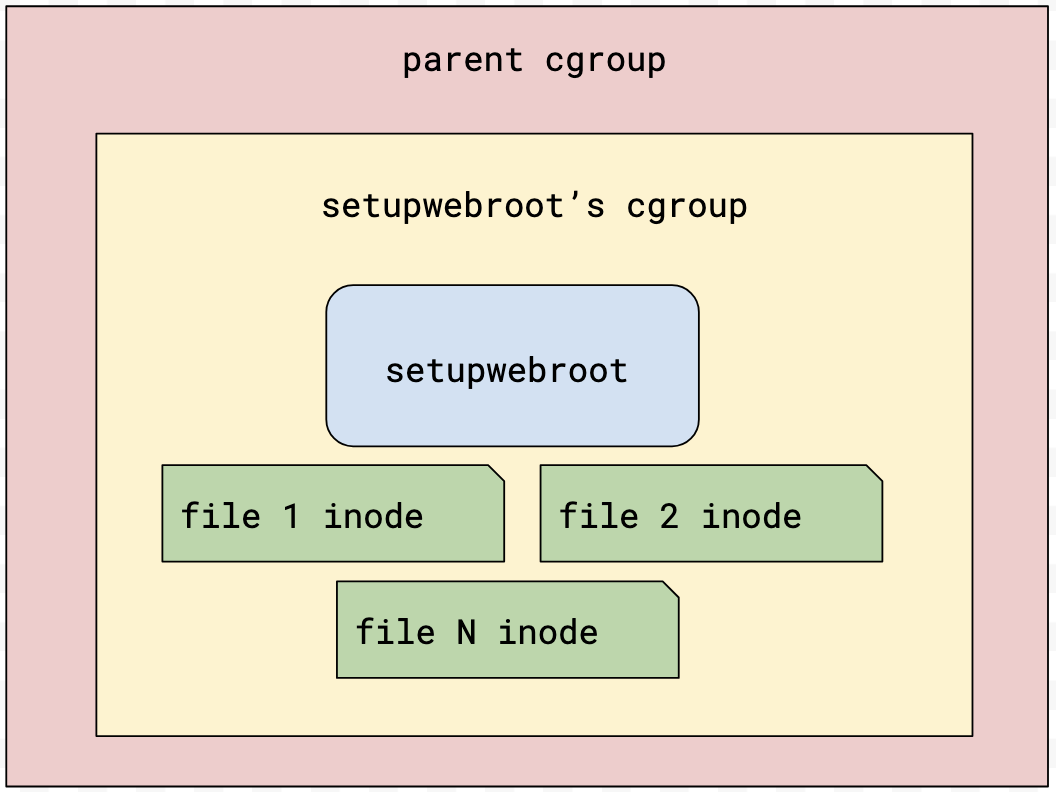 Initially, inodes are assigned to
 setupwebroot’s cgroup
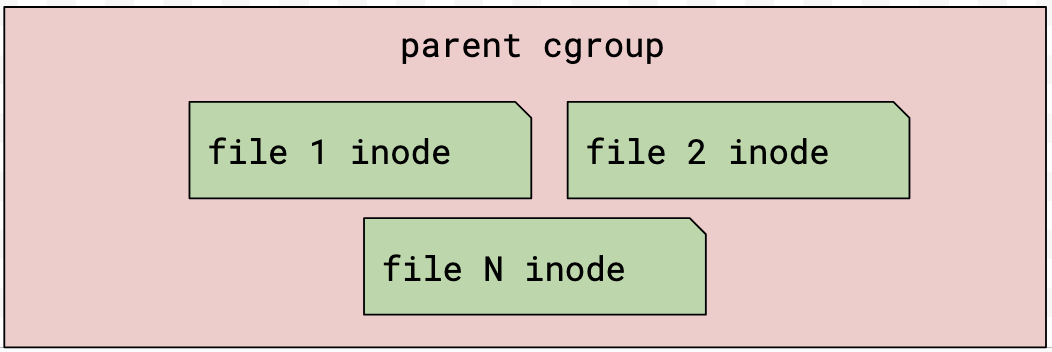
setupwebroot finishes. Systemd removes its cgroup, and inodes are moved to the parent cgroup
The inode_switch_wbs_work_fn that we believed was causing the elevated system CPU is responsible for moving an inode from one cgroup to another in the context of writeback. We got more insight by running this bpftrace command on a newly booted host:
% sudo bpftrace -e '
tracepoint:writeback:inode_switch_wbs {
  printf(
    "[%s] inode is switching! inode: %d old cgroup: %d new cgroup: %d\n",
    strftime("%H:%M:%S", nsecs),
    args->ino,
    args->old_cgroup_ino,
    args->new_cgroup_ino
  );
}'
During the spike in system CPU, we saw thousands of these lines printed out by the bpftrace command:
[20:49:30] inode is switching! inode: 3730800 old cgroup: 22438 new cgroup: 88
[20:49:30] inode is switching! inode: 3730799 old cgroup: 22438 new cgroup: 88
...
Each line corresponds to a file written by setupwebroot that was switching from setupwebroot’s dying cgroup to the parent cgroup. The old cgroup identifier (22438) corresponds to setupwebroot’s cgroup. The new cgroup identifier (88) corresponds to the parent cgroup.
The bpftrace command prints out data from a kernel tracepoint in the Linux kernel’s writeback code. The fields available to print in this tracepoint can be viewed via:
% sudo cat /sys/kernel/debug/tracing/events/writeback/inode_switch_wbs/format
name: inode_switch_wbs
ID: 886
format:
    field:unsigned short common_type;   offset:0;   size:2; signed:0;
    field:unsigned char common_flags;   offset:2;   size:1; signed:0;
    field:unsigned char common_preempt_count;   offset:3;   size:1; signed:0;
    field:int common_pid;   offset:4;   size:4; signed:1;

    field:char name[32];    offset:8;   size:32;    signed:0;
    field:ino_t ino;    offset:40;  size:8; signed:0;
    field:ino_t old_cgroup_ino; offset:48;  size:8; signed:0;
    field:ino_t new_cgroup_ino; offset:56;  size:8; signed:0;

print fmt: "bdi %s: ino=%lu old_cgroup_ino=%lu new_cgroup_ino=%lu", REC->name, (unsigned long)REC->ino, (unsigned long)REC->old_cgroup_ino, (unsigned long)REC->new_cgroup_ino
We found that when we added a sleep 3600 to the end of the script that setupwebroot executes, we could delay the spike in system CPU by one hour. Because systemd only removes a service’s cgroup when its process exits, the sleep delayed when inodes switched from one cgroup to another.
The fix #
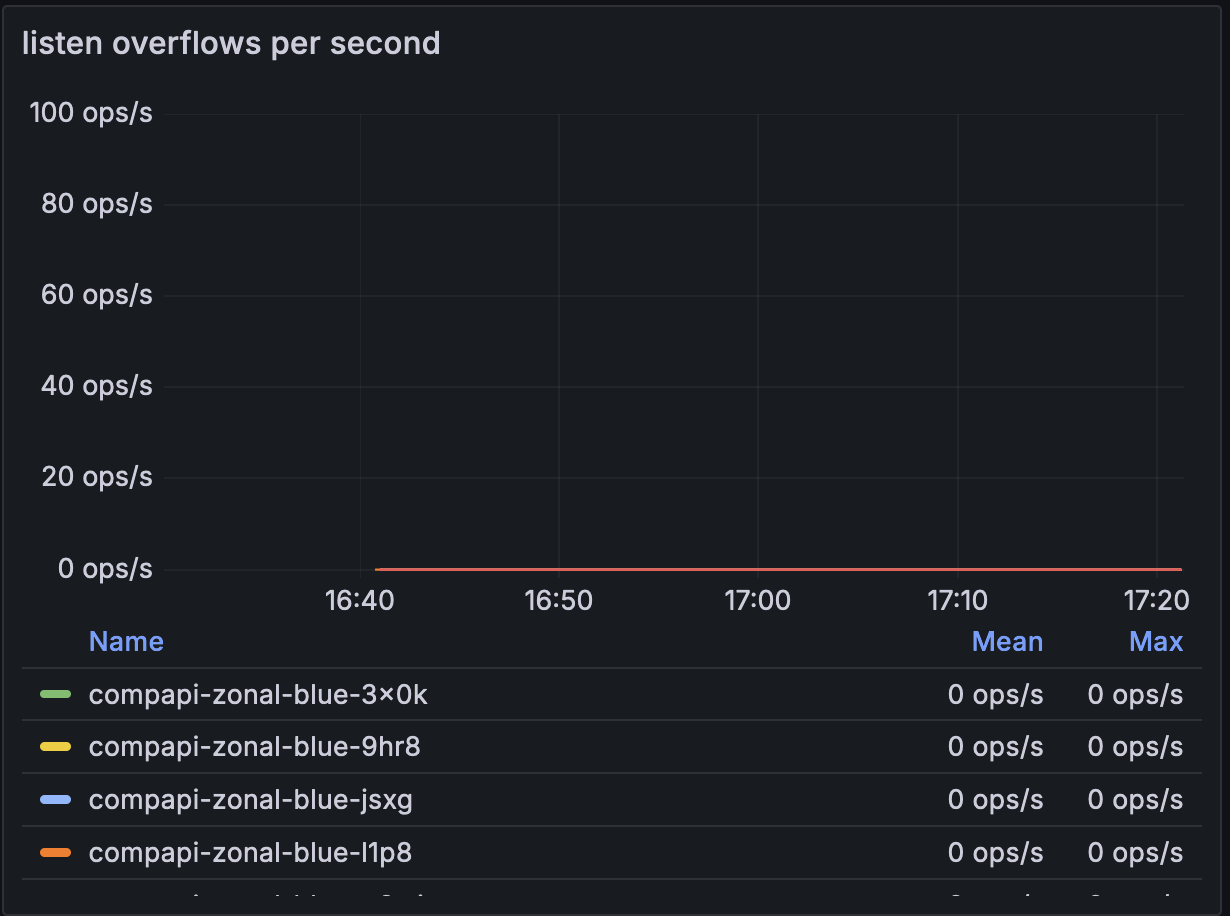
We found a systemd directive that allows us to turn off certain cgroup accounting features: DisableControllers. If either the io or memory controllers are disabled, the kernel will not perform cgroup writeback or any of the related accounting and cgroup switching. We found that by creating a systemd slice with those controllers disabled and configuring setupwebroot’s unit file to use that slice, we could no longer reproduce the elevated system CPU. We had solved our performance issue.
No more system CPU spike and no more listen overflows:
Followup questions #
Do we have a minimal reproduction script? #
We came up with a minimal reproduction of the issue:
$ sudo mkdir -p /var/random-files && sudo systemd-run --property=Type=oneshot bash -c 'dd if=/dev/urandom bs=1024 count=400000 | split -a 16 -b 1k - /var/random-files/file.'
This command creates 400,000 files, each consisting of 1,024 random bytes. The files have names like /var/random-files/file.aaaaaaaaaaaaaaaa and /var/random-files/file.aaaaaaaaaaaaaaab. This command is run as a systemd oneshot service. Within anywhere from 30 seconds to 3 minutes after this command finishes, we see a spike in system CPU. Viewing htop will confirm this (press shift + k to show kernel threads in htop) – we see kernel workers using lots of CPU in the function inode_switch_wbs.
Why wasn’t CentOS affected? #
The initial release of cgroups, known as cgroups v1, was in kernel version 2.6.24. Cgroups v1 has since been replaced by a new implementation: cgroups v2. Cgroups v2 was officially released in kernel version 4.5. Our old CentOS operating system used kernel version 3.10. We believe this inode switching CPU issue is related to the io and memory controllers introduced in cgroups v2. Thus CentOS, which uses cgroups v1, is not vulnerable to this issue.
Why couldn’t we reproduce when running rsync manually? #
Recall that when we ran the rsync command from setupwebroot manually in our interactive shell, we saw no spike in system CPU. It turns out that each interactive ssh session you have open creates its own cgroup. Below is the output of systemd-cgls on a web server on which I have two interactive ssh sessions open. One session is running a sleep 100 command, and the other session is running systemd-cgls. The two cgroups are called session-17450.scope and session-17455.scope:
% sudo systemd-cgls
Control group /:
-.slice
├─user.slice
│ └─user-10101.slice
│   ├─[email protected] …
│   │ └─init.scope
│   │   ├─1710746 /lib/systemd/systemd --user
│   │   └─1710793 (sd-pam)
│   ├─session-17450.scope
│   │ ├─1708943 sshd: dleibovic [priv]
│   │ ├─1711073 sshd: dleibovic@pts/0
│   │ ├─1711171 -zsh
│   │ └─1716022 sleep 100
│   └─session-17455.scope
│     ├─1780667 sshd: dleibovic [priv]
│     ├─1781414 sshd: dleibovic@pts/1
│     ├─1781577 -zsh
│     └─1791367 systemd-cgls
...
These session-*.scope cgroups stick around until you terminate your ssh session. After terminating your ssh session, systemd removes the corresponding cgroup. With this insight, we tested terminating the interactive ssh session after manually running the rsync commands. Sure enough, about 2 minutes after we terminated the ssh session, we saw the big spikes in system CPU caused by inode cgroup switching.
Is this a hypervisor or a kernel performance issue? #
We suspected that this performance issue was caused by either the hypervisor or the kernel. We shared our findings with Canonical, the company behind Ubuntu. Canonical confirmed that it is a kernel issue that was likely introduced by a Linux kernel commit from 2021. More details are available in the public bug report, in which I have commented. We are hopeful that Canonical will engage with the Linux kernel developers and eventually fix this performance issue.